We've analyzed 1,000 Walmart Canada Facebook posts to figure out what works and doesn't so that social media practitioners and can improve their own social media marketing strategies.
We’ve analyzed 1,000 Walmart Canada Facebook posts (published between March 6, 2020 – August 31, 2024), to figure out what works and doesn’t work for Walmart Canada’s Facebook strategy, and how other retail brands can improve their own social media marketing efforts.
While this data is specific to Walmart Canada, the findings are relevant to social media practitioners everywhere, especially those in the retail sector. Use these insights to create or refine impactful strategies tailored to your unique brand and target audience.
Is there another brand or sector you’d like us to analyze? Let us know! Email [email protected] with your request. 👍
1. Overview

Let’s start off with some quick facts to set the stage:
- Walmart Canada’s Facebook page was launched in 2012. and current has 1.3 million followers
- It is managed by over 60 people all over the world:
- 34 in Canada
- 11 in the U.S.
- 6 in India
- 4 in the UK, Netherlands, Egypt, and Argentina
- Facebook engagement per post is down -500% since 2024.
title
As social media professionals, we know that algorithms evolve and audience interests change. That’s why it’s crucial to monitor the data and adapt constantly. We need to look at what our metrics are telling us and respond accordingly. Not acting on these insights will jeopardize all the time and money we’ve invested in building up these channels.
2. Best time of day to post
The data reveals that morning posts (published between 6 a.m. and 12 p.m. EST) and evening posts (published between 6 p.m. and 12 p.m.) get the best organic engagement on Walmart Canada’s Facebook page.
Best time of day to post
3. Most and least engaging content
When Walmart Canada’s content is organized into themes, it becomes clear what kind of posts get the best organic engagement.
Best time of day to post
But wait! We need to look at the number of posts in each category. “Guidelines and Information” has the highest engagement, but there were only 7 posts in this category. Statistically, we’re looking at a huge margin of error and low level of confidence here.
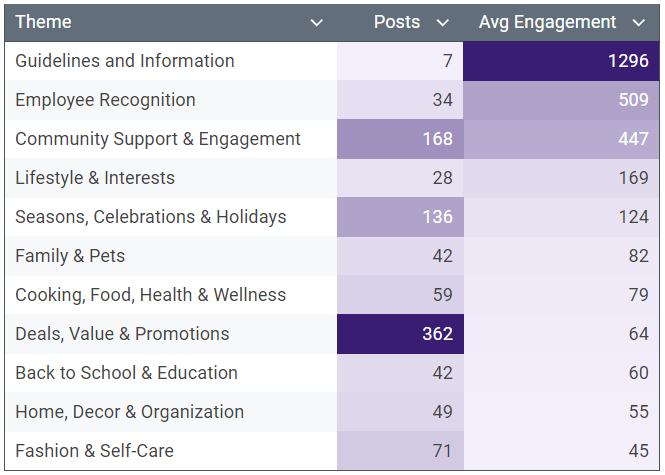
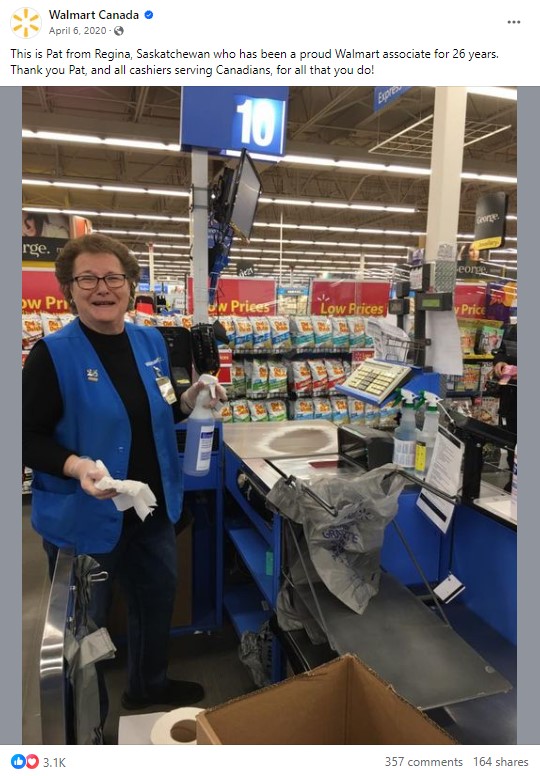
Walmart Canada’s social media managers (and any others in the retail space) should post more “Employee Recognition” content. Don’t forget to stay on top of the data as it becomes statistically relevant. Also, keep it up with the “Community Support & Engagement” posts! They do consistently well. Conversely, step back from “Fashion & Self-Care” and “Home Decor & Organization” categories, as they are consistently the worst-performing post categories.
“Employee Recognition” and “Community Support & Engagement” posts = high engagement 👍
“Fashion & Self-Care” and “Home Decor & Organization” posts = low engagement 👎
4. Photo vs. video posts
Here’s a surprising trend: photo posts significantly outperform videos in driving total engagements on Walmart Canada’s Facebook page.
Photo vs video posts
Why are photos getting more engagement on average than video posts? Since we can’t know how many people each post has reached (as it’s not public information), we can’t be certain if it’s due to the algorithm or to lack of interest. It could be a mix of both.
Let’s take a look at another metric, video engagement rate, to see if there’s any other context that might help. To get the following data, we divided total engagements by total number of video views for each year (both are publicly available).
Engagement vs views
Lucky for Walmart Canada, we can see that the engagement rate for videos is trending up. In other words, for each view, the chances that it someone will engage with it (i.e. react, share, or leave a comment) are getting better and better. This might be the reason that Walmart Canada’s Facebook strategy has favored videos instead of photos since 2022. The chart below compares the percentage of posts that contain a photo to those that contain a video.
The data shows that almost all posts now contain a video instead of a photo even though, as we have seen, photos continue to outperform videos in terms of engagement value.
Photo vs Video post %
5. Video analysis
OK, we know that photo posts do better than video posts for Walmart Canada’s Facebook audience. Now let’s take a look at what kinds of videos do best.
To begin with, we’ll look at video views.
A video view is counted any time a video has played for at least 3 seconds. On a desktop, the full video frame has to be in view before it starts playing. On a mobile device, half of the video has to be on screen before it starts playing. This ensures that someone scrolling through their feed is actually pausing to check it out.
Out of 334 videos, the top 10% of videos had an average of 11,527 views, and the bottom 10% had an average of 1,775 views.
Most-viewed videos:
Least-viewed videos:
So let’s figure out what is causing the most viewed videos to be on top.
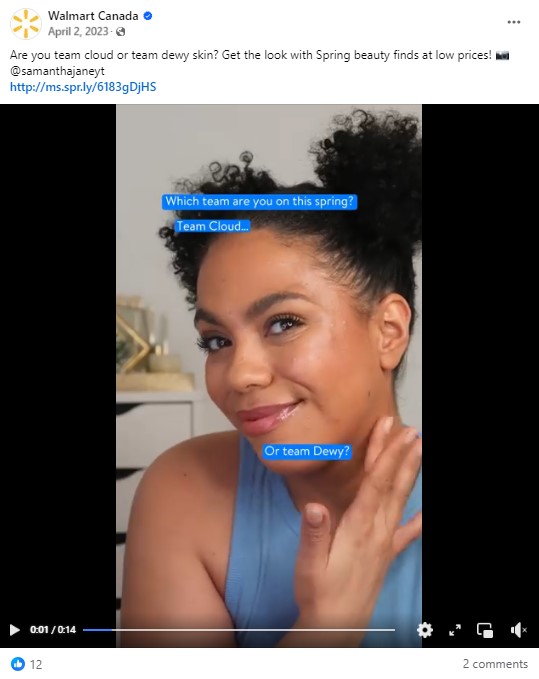
Just looking at the thumbnails, nothing jumps out at us as the defining feature of a successful video. There’s a blend of seasonal, point of view, solo, and group shots.
Looking at the data in aggregate, certain trends bubble to the surface, starting with video ratios.
Average video views by ratio
Here, we can see that vertical videos tend to get about 1,000 more views on average than square videos. This is likely due to most video consumption being done on smartphones, and the Facebook algorithm prioritizing vertical video for this purpose.
Average video engagement rate by ratio
If we move into Engagement rate, however, square videos increasingly get the most engagement. It’s not clear why this is the case. Perhaps people tend to engage more (share, comment, react) when using a desktop device.
Most viewed videos
Least viewed videos
Looking at the use of text overlays and captions, another funny trend can be found. It looks like the use of simple white captions encourage more views than bold and colorful superimposed captions.
What is also interesting is that sometimes the least viewed videos are actually the most engaging.
As we refine our processes and further develop our analytics platform, we’ll be able to uncover deeper insights into what kind of video content leads to higher ROI.
Share this article
Written by David
David is the founder and CEO of Makemi. He's been a designer and marketer since the early 2000s and has driven organizational strategy since at least 2015. When he isn't working, David plays ultimate frisbee and spends time with his family. He wishes he still had time to play guitar.

